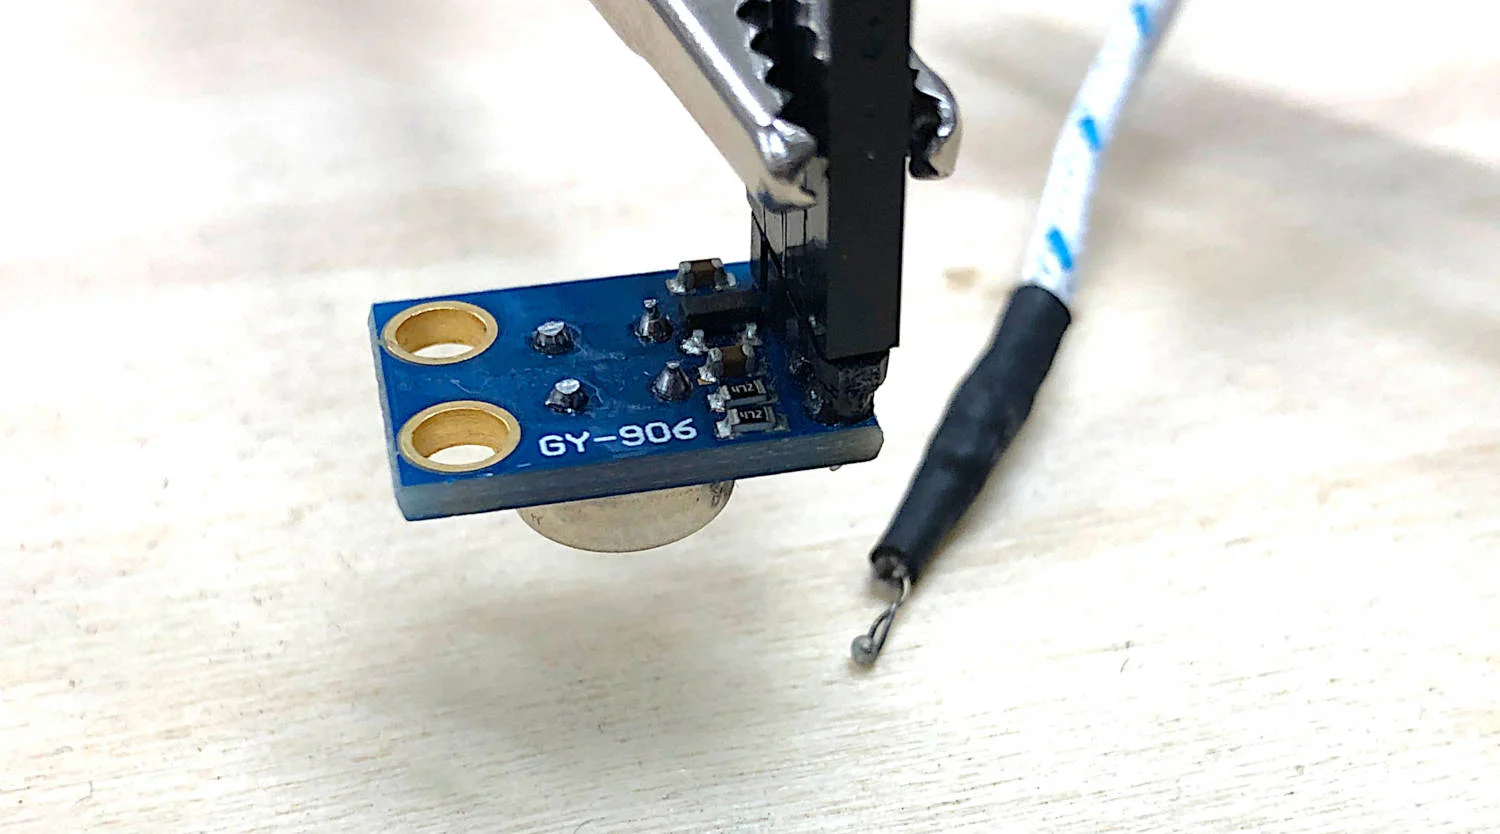
In this tutorial, I will explore black body radiation, infrared detectors, and the relationship between temperature and emissivity - all with the intention of exploring how infrared (IR) detectors measure temperature from a distance. Arduino will be used, along with an MLX90614 IR thermometer, and a thermocouple for true-temperature approximation of each object. Planck’s discovery of energy quanta and their relationship to thermodynamics is the basis for radiation detectors and infrared temperature sensors. We will use Planck’s law to derive a usable equation that can relate the radiation measured by an infrared sensor to the temperature of a radiative object.
Read MoreThe third entry of the satellite imagery analysis in Python uses land surface temperature (LST) as the data variable along with land cover information from the national (U.S.) database. The land cover information will allow us to create a relationship between land cover type and its respective heating (or cooling) contribution to the earth’s surface. Land cover is used in many applications ranging from algorithm development to military applications and crop surveying, not to mention applications in water management and drought awareness.
Read MoreFor part II, the focus shifts from the introduction of file formats and libraries to the geospatial analysis of satellite images. Python will again be used, along with many of its libraries. Land Surface Temperature will again be used as the data information, along with shapefiles used for geometric boundary setting, as well as information about buildings and land cover produced by local governments - all of which are used in meteorological and weather research and analyses.
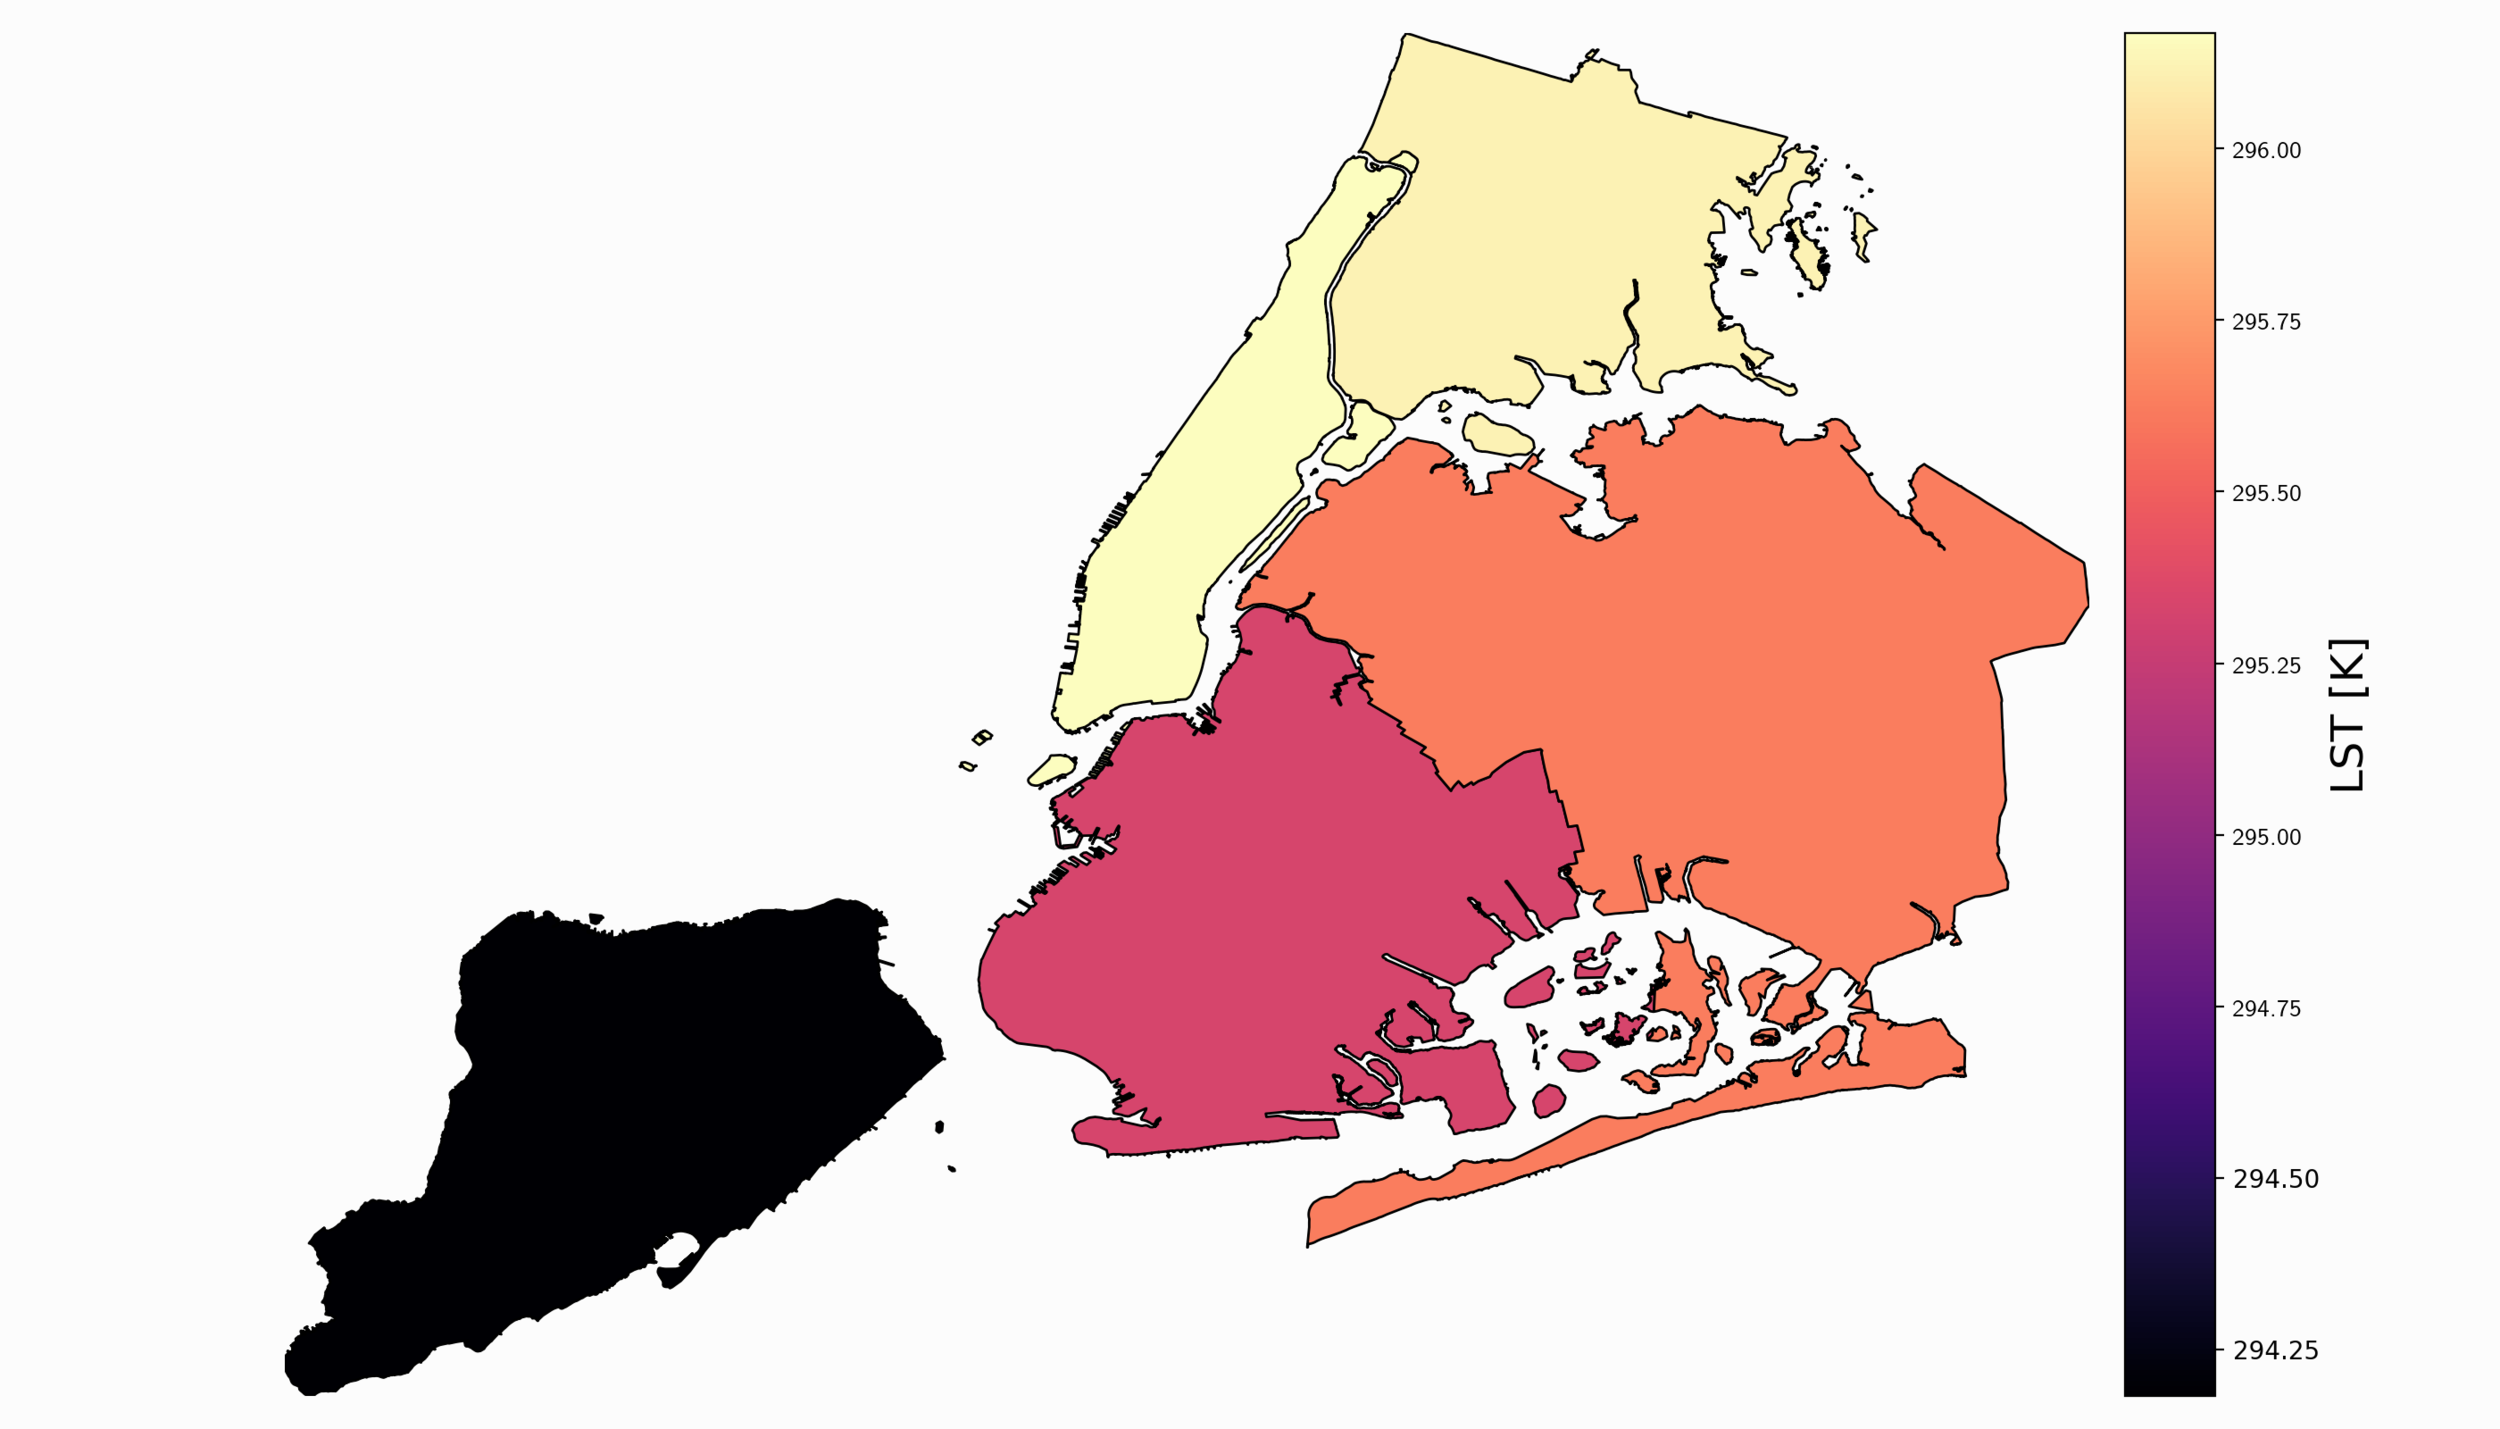
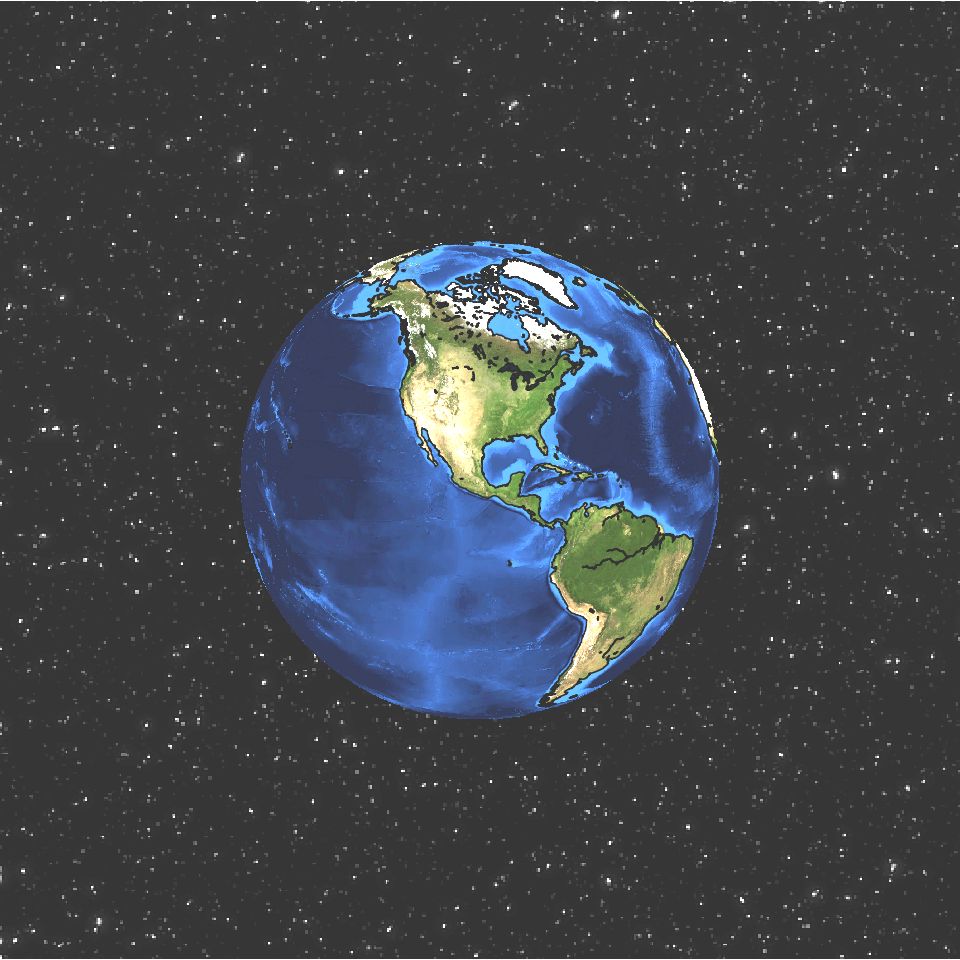
Read MoreIn this tutorial series, Python’s Basemap toolkit and several other libraries are utilized to explore the publicly-available Geostationary Operational Environmental Satellite-16 (GOES-16). In this first entry, the following will be introduced: acquisition of satellite data, understanding of satellite data files, mapping of geographic information in Python, and plotting satellite land surface temperature (LST) on a map.
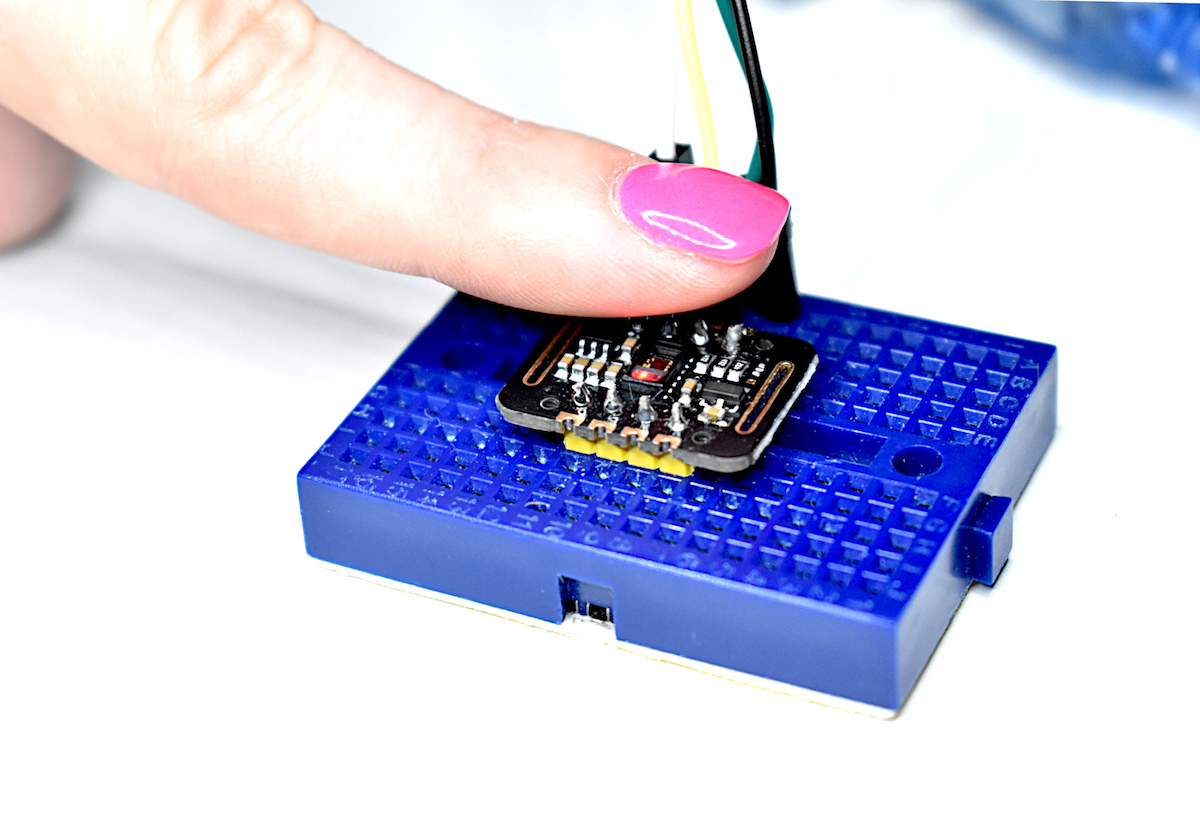
Read MorePulse oximetry monitors the oxygen saturation in blood by measuring the magnitude of reflected red and infrared light [read more about pulse oximetry here and here]. Pulse oximeteters can also approximate heart rate by analyzing the time series response of the reflected red and infrared light . The MAX30102 pulse oximeter is an Arduino-compatible and inexpensive sensor that permits calculation of heart rate using the method described above. In this tutorial, the MAX30102 sensor will be introduced along with several in-depth analyses of the red and infrared reflection data that will be used to calculate parameters such as heart rate and oxygen saturation in blood.
Read MoreThe picamera and edge detection routines will be used to identify individual objects, predict each object’s color, and approximate each object’s orientation (rotation). By the end of the tutorial, the user will be capable of dividing an image into multiple objects, determining the rotation of the object, and drawing a box around the subsequent object.
Read MoreIn this entry, image processing-specific Python toolboxes are explored and applied to object detection to create algorithms that identify multiple objects and approximate their location in the frame using the picamera and Raspberry Pi. The methods used in this tutorial cover edge detection algorithms as well as some simple machine learning algorithms that allow us to identify individual objects in a frame.
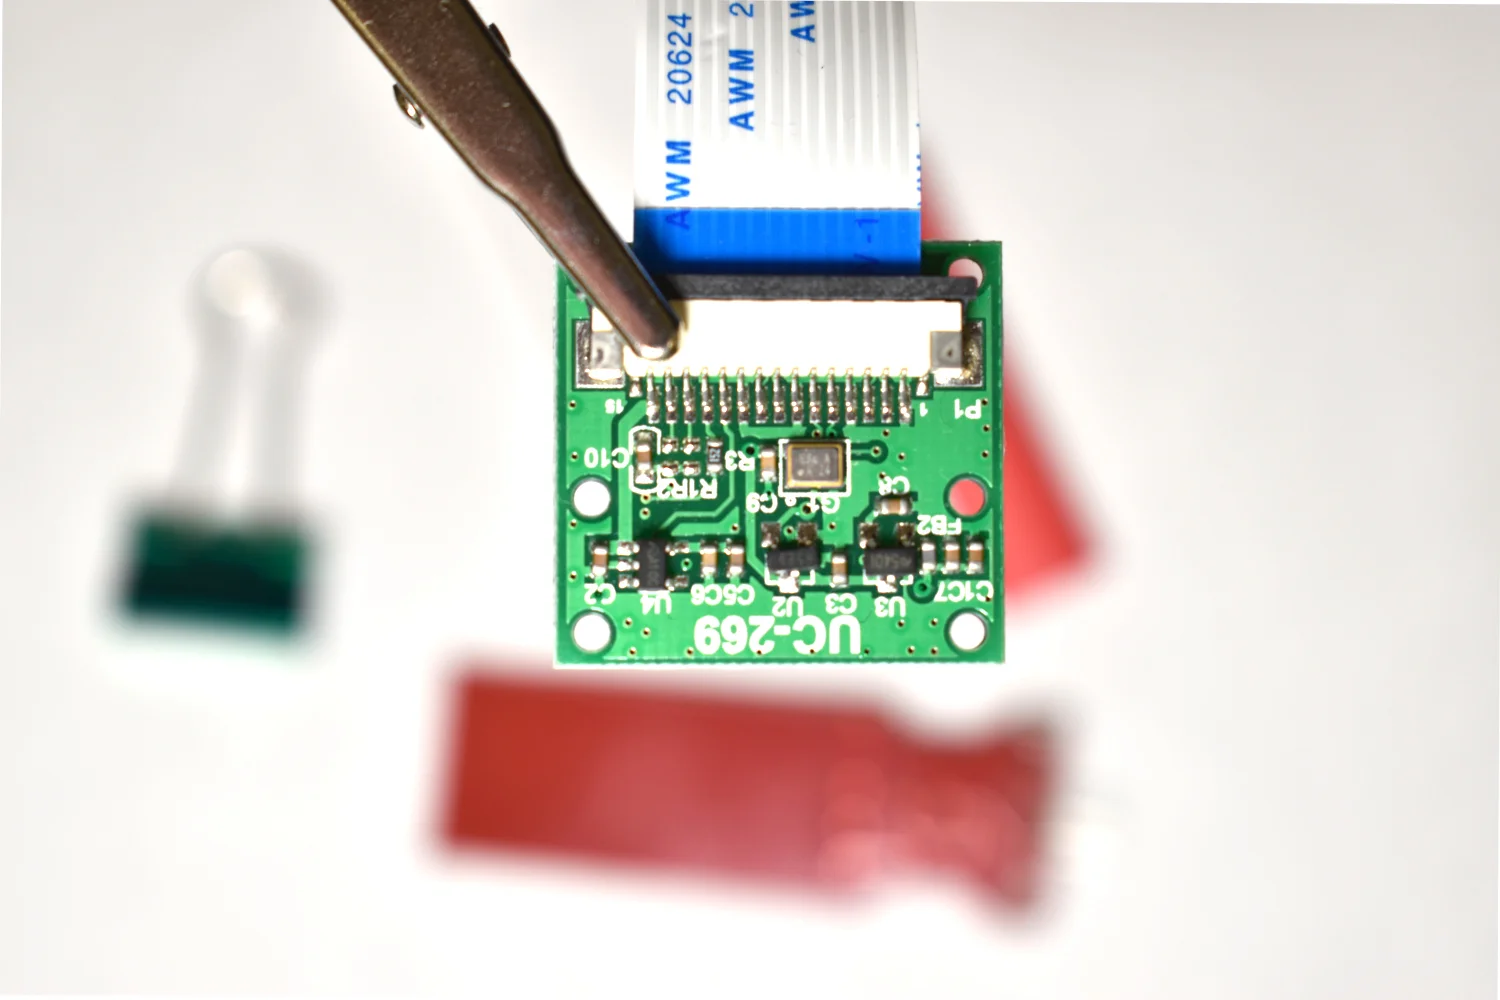
Read MoreThe Raspberry Pi has a dedicated camera input port that allows users to record HD video and high-resolution photos. Using Python and specific libraries written for the Pi, users can create tools that take photos and video, and analyze them in real-time or save them for later processing. In this tutorial, I will use the 5MP picamera v1.3 to take photos and analyze them with Python and an Pi Zero W. This creates a self-contained system that could work as an item identification tool, security system, or other image processing application. The goal is to establish the basics of recording video and images onto the Pi, and using Python and statistics to analyze those images.
Read MoreTime of flight (ToF) is an approximation of the time it takes a traveling wave to come in contact with a surface and reflect back to the source. Time of flight has applications in automotive obstacle detection, resolving geographic surface composition, and computer vision and human gesture recognition. In the application here, the VL53L1X ToF sensor will be used to track the displacement of a ping pong ball falling down a tube. We can predict the acceleration and behavior of a falling ping pong ball by balancing the forces acting on the ball, and ultimately compare the theory to the actual displacement tracked by the time of flight sensor.
Read MoreUsing the Euler-Bernoulli beam theory, the resonant frequencies of a beam will be measured using a thin film piezoelectric transducer and compared to the theoretical calculations. A Raspberry Pi will be used along with a high-frequency data acquisition system (Behringer UCA202, sample rate: 44.1kHz) and the Python programming language for analysis. The fast fourier transform will allow us to translate the subtle beam deflections into meaningful frequency content. This tutorial is meant to introduce Python and Raspberry Pi as formidable tools for vibration analysis by using measurements as validation against theory.
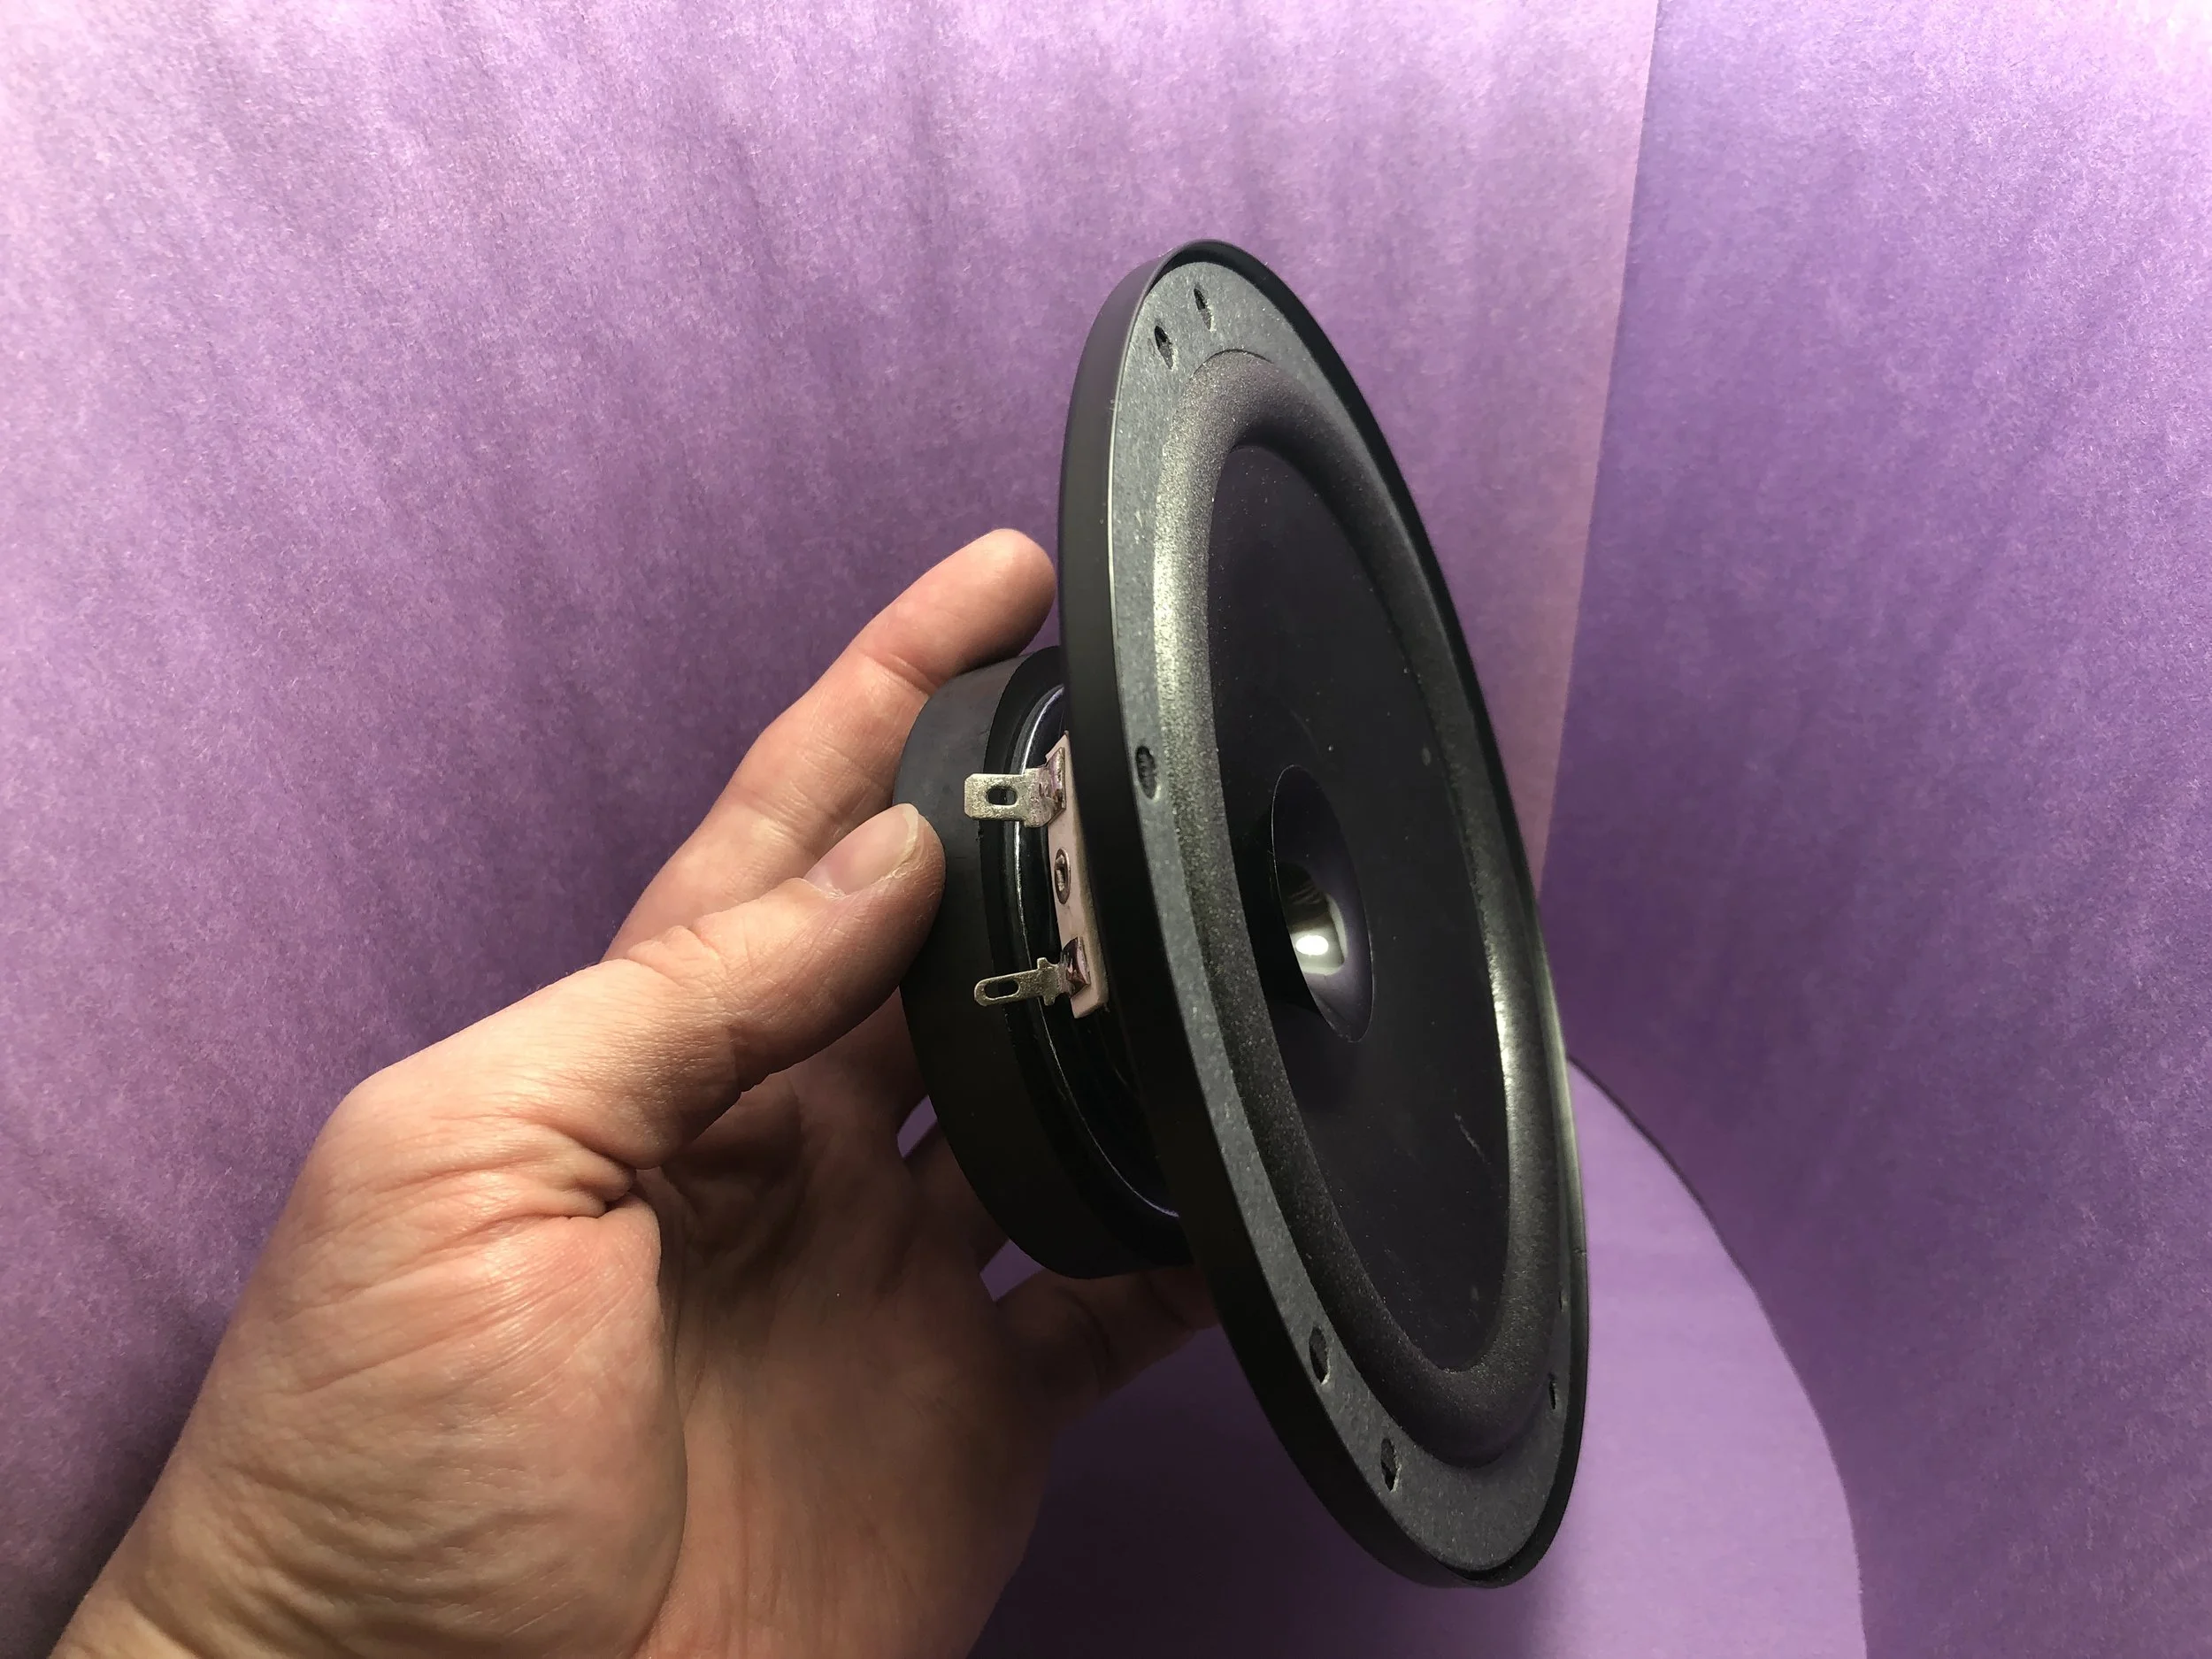
Read MorePart II of the tutorial series on loudspeaker analysis and experiments. The majority of this entry focuses on finding Thiele-Small parameters to fully characterize an electrodynamic loudspeaker in free air.
Read MoreIn this tutorial, a loudspeaker will be analyzed by calculating the Thiele-Small parameters from impedance measurements using an inexpensive USB data acquisition system (minimum sampling rate of 44.1 kHz). The methods used in this project will educate the user on multiple engineering topics ranging from: data acquisition, electronics, acoustics, signal processing, and computer programming.
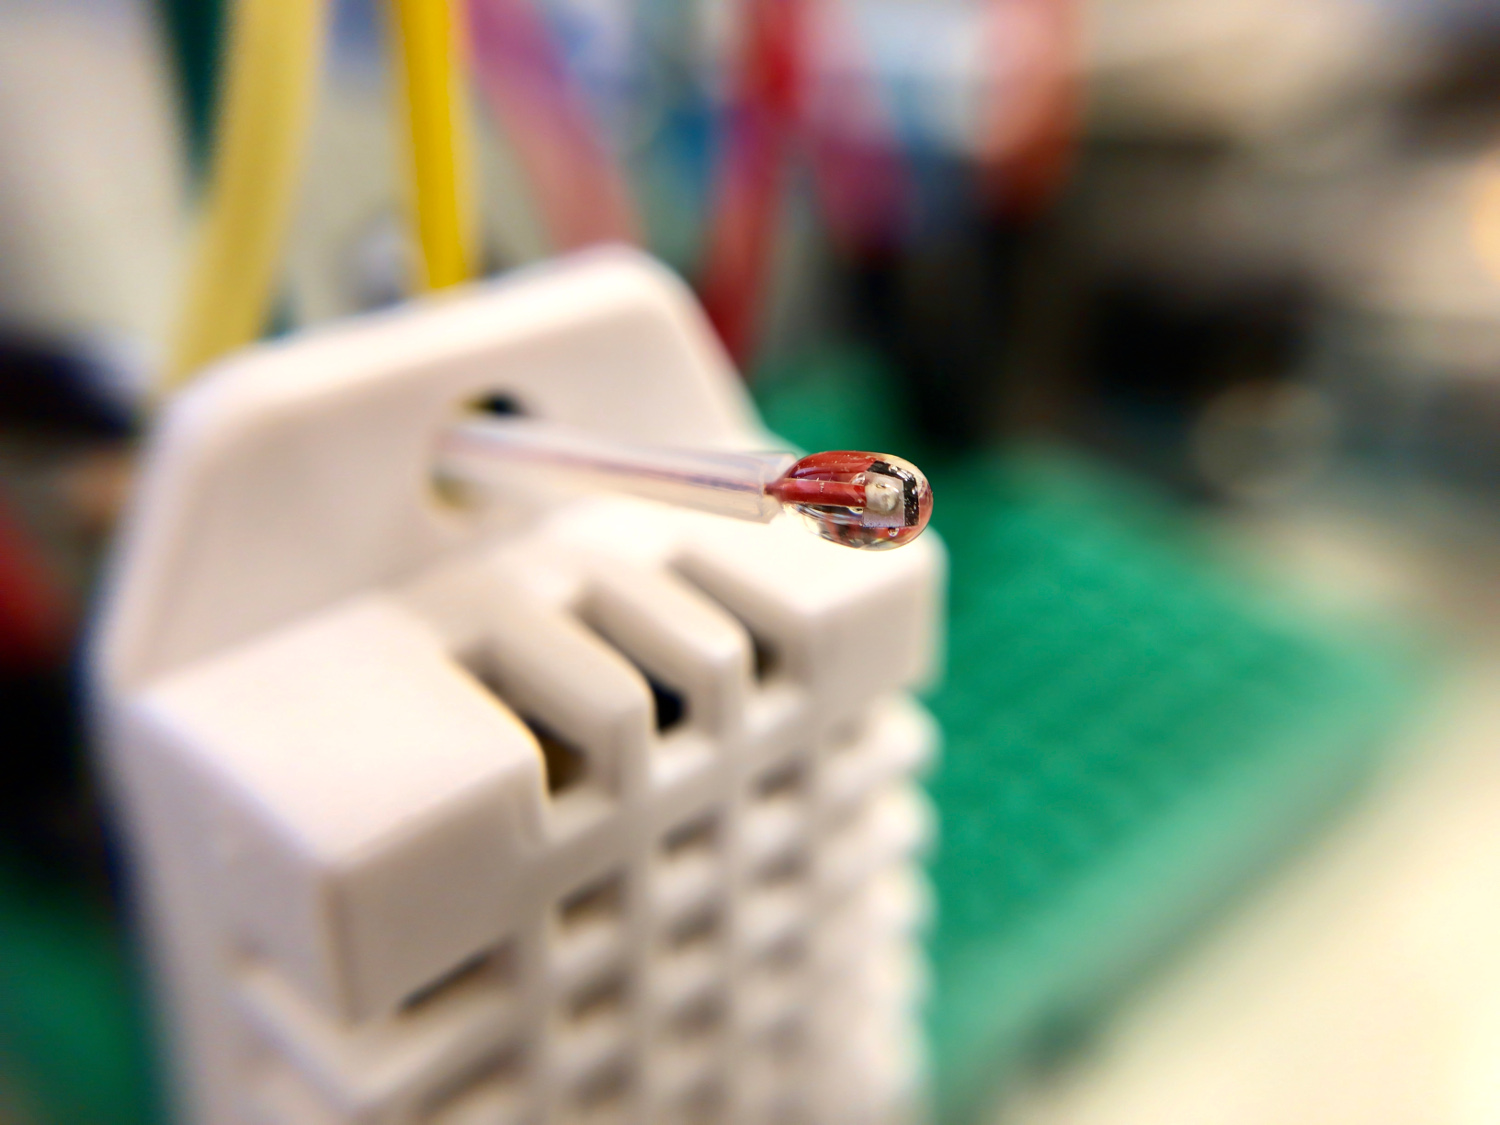
Read MoreThermistor, whose name is derived from a combination of thermal and resistor, is a temperature sensing device that registers changes in internal resistance as a function of temperature. Thermistors are often chosen over thermocouples because they are more accurate, have a shorter response time, and are generally cheaper. For most applications, thermistors are the smart and easy selection for temperature sensing below 300 degrees Celsius. In our case, we will be using a Negative Temperature Coefficient (NTC) thermistor, where the resistance decreases as the temperature increases. NTC thermistors are most common in commercial products that operate in the tens of degrees like thermostats, toasters, and even 3-D printers. An NTC 3950 100k thermistor will be used, which is designed for 100kOhm resistance at 25 degrees Celsius. This tutorial will introduce methods for relating resistance to temperature by fitting factory calibration data. The performance of the thermistor will also be evaluated using an Arduino board and a simple Newton’s law of cooling experiment.
Read MoreCalculating latitude and longitude from a GOES-R L1b data file. The GOES-R L1b radiance files contain radiance data and geometry scan information in radians. This information is not enough to plot geographic radiance data right from the file, however, after some geometric manipulation harnessing satellite position and ellipsoid parameters, we can derive latitude and longitude values from the one-dimensional scan angles and plot our data in projected formats familiar to many geographic information tools.
Read MoreIn this continuation of the audio processing in Python series, I will be discussing the live frequency spectrum and its application to tuning a guitar. I will introduce the idea of nodes and antinodes of a stringed instrument and the physical phenomena known as harmonics. This will give us a better idea of how to tune the guitar string-by-string and also discern the notes of a given chord - all calculated using the FFT function in Python.
Read MoreRaspberry Pi 3B+ acoustic analysis using Python. Audio recording and signal processing with Python, beginning with a discussion of windowing and sampling, which will outline the limitations of the Fourier space representation of a signal. Discussion of the frequency spectrum, and weighting phenomenon in relation to the human auditory system will also be explored. Lastly, the significance of microphone pressure units and conversion to the decibel will be briefly introduced and explained.
Read MoreFourier Series has been widespread in applications of engineering ranging from heat transfer, vibration analysis, fluid mechanics, noise control, and much more. After evolutions in computation and algorithm development, the use of the Fast Fourier Transform (FFT) has also become ubiquitous in applications in acoustic analysis and even turbulence research. In this tutorial, I describe the basic process for emulating a sampled signal and then processing that signal using the FFT algorithm in Python. This will allow the user to get started with analysis of acoustic-like signals and understand the fundamentals of the Fast Fourier Transform.
Read More
