Interactive MTA/New York MetroCard Calculator to Avoid Overpaying
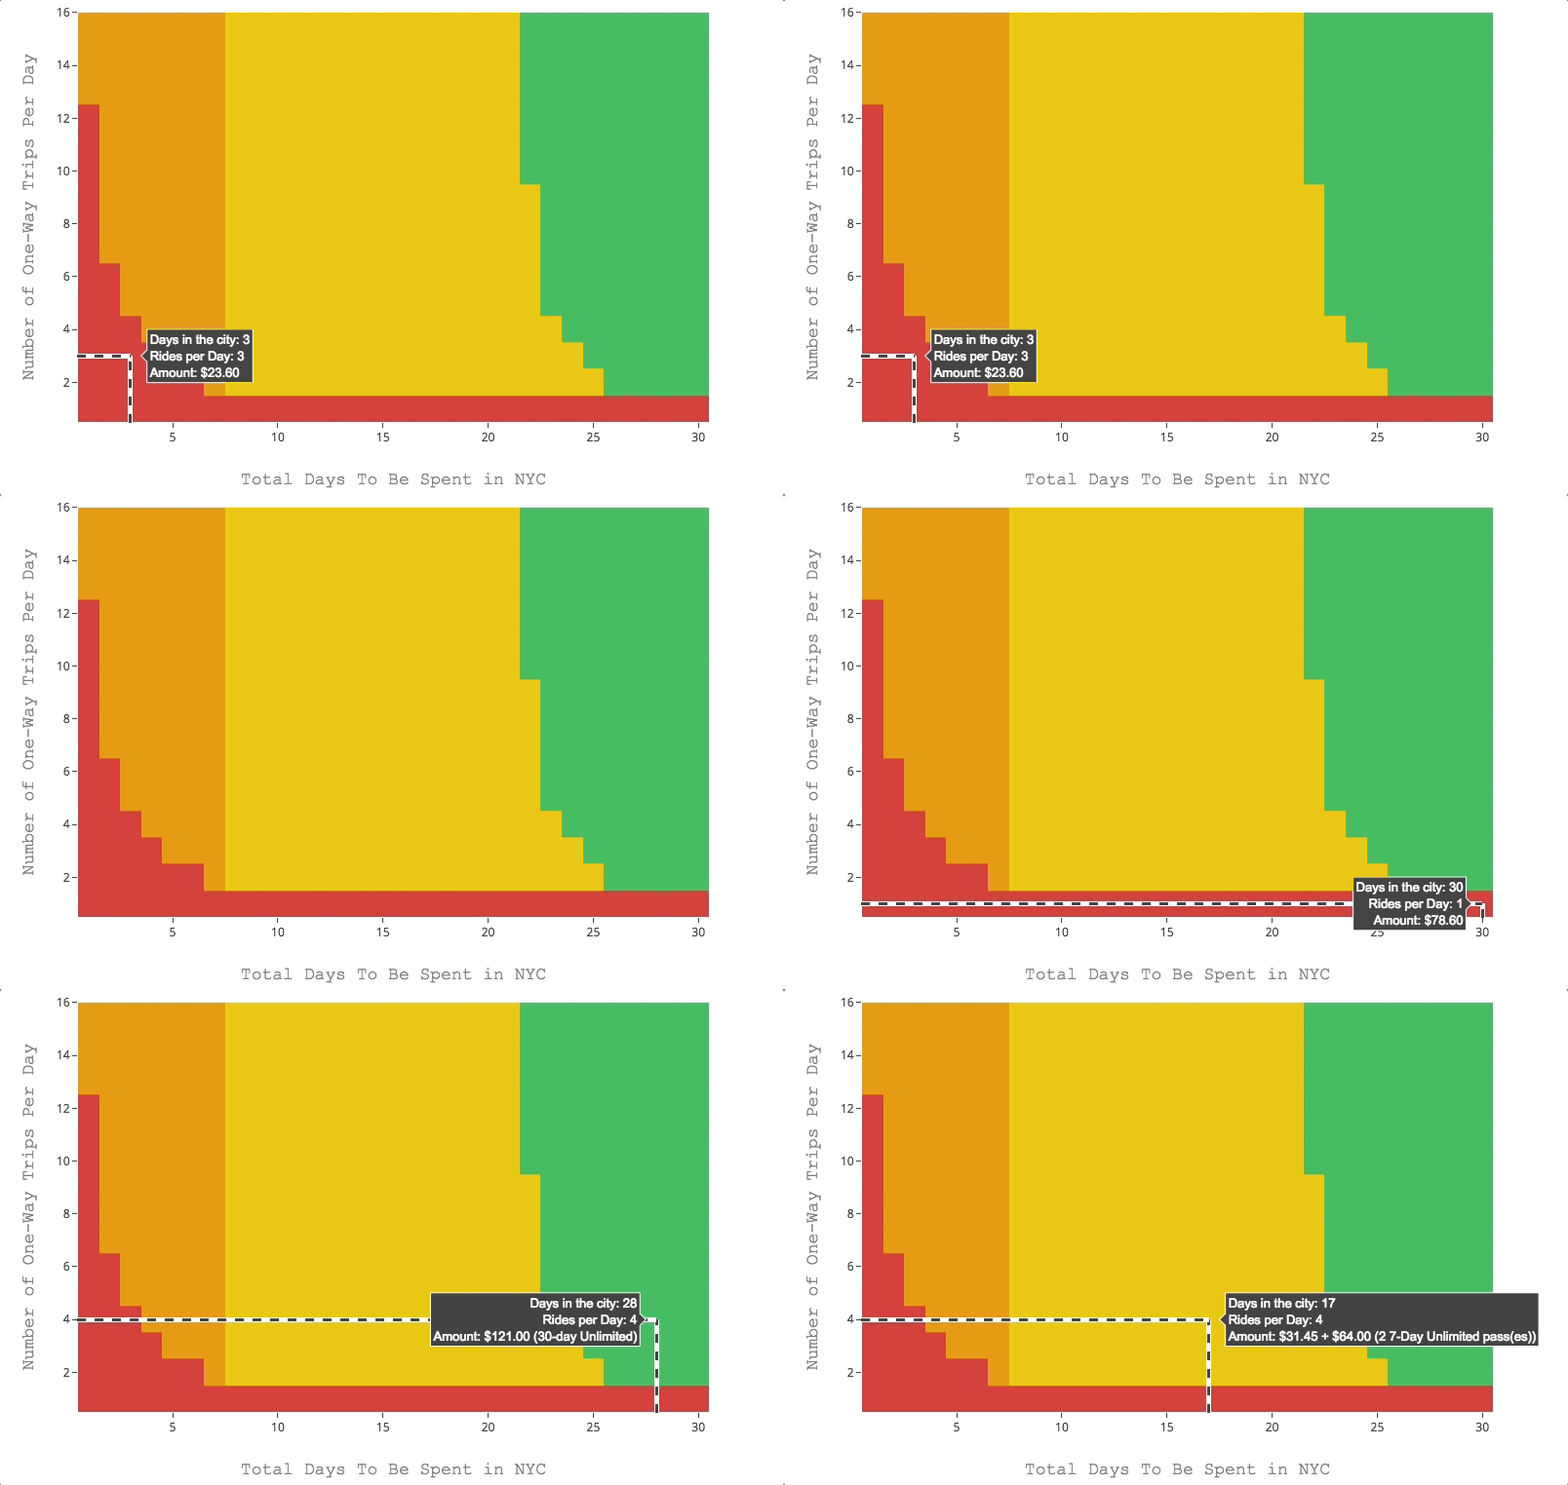
Below, I outline the methods used in the above chart for avoiding leftover amounts when purchasing rides on a MetroCard, as well as thresholds for purchasing unlimited rides for both 7-day and 30-day passes.
MTA MetroCard Information and Cost Optimization
The Metrocard bonus adds 5% to the total purchase price, which can be represented as follows:
where T is the total added to the MetroCard, P is the amount paid, and the 1.05 is the total plus the added 5%.
Therefore, if we want to purchase 5 rides and avoid having leftover change on the MetroCard, we need to calculate the approximate amount (in multiples of $0.05 per MTA's requirement) to add to the card to get closest to the cost of 5 rides while also incorporating the extra 5%. This can be calculated in the following manner:
NOTE:
Remember to always round -UP- when calculating the total for the desired number of rides, otherwise you will end up with a large amount left over just shy of another ride.Interactive MTA/New York MetroCard Calculator Description
Using the method above and an algorithm that optimizes cost and unlimited ride options, I created the interactive chart at the top of this page that shows subway riders when to buy single purchase amounts, 7-day unlimited passes, and 30-day unlimited passes. For cases beyond 7 days in the city, I have also included an optimized mix of single pay options and 7-day options. For amounts greater than the 30-day unlimited cost, I have recommended the 30-day unlimited pass. In every case, the chart shows the rider which option is financially advantageous based on the days in the city and rides per day.
See More in Programming and Python:


In this tutorial, the aim is to characterize a solar panel by varying the load at (near) peak solar insolation to identify the panel's nominal values such as open-circuit voltage, short-circuit current, max power voltage and current, and max power output. These values help users understand the expectations from a photovoltaic array and how their power needs may be met with a given PV system. An Arduino board will be used to log the current and voltage values outputted from a small solar panel. The current and voltage are measured using a 16-bit analog-to-digital converter power module, the INA226, which will allow us to track the power outputted from the photovoltaic panel. A potentiometer acting as a rheostat will serve as the varying load on the system, which will be used to identify the peak power points of the system. Finally, analyses will be conducted in Python 3, which will allow us to identify the peak power region and also the total power outputted over a duration of 24 hours.